
Okay, let’s be honest…
Listening to some random marketing agency on the internet talk about marketing metrics and KPI’s is enough to make you want to call it quits, close down shop, race to the forest and never think about marketing ever again.

Luckily for you, there’s no need to go into the wilderness today. In this article, we’re going to dive into the world of metrics in a concise, easy-to-understand and refreshingly simple way that you can actually ACTION.
Grab a cup of coffee, sit back and let’s embark on this metric-filled adventure together. It’s time to bring some excitement and practicality to the world of digital marketing metrics and KPIs. Trust me, you won’t need a snooze button for this one!
If you’re more of a visual learner, feel free to watch my overview video below:
What are metrics in Digital Marketing?
Digital marketing metrics simply refer to measurements, numbers and statistics that give you a glimpse into the performance of your marketing efforts. They help you understand what’s working, what’s not, and where you should steer your marketing ship. Without metrics, it’s like trying to dance blindfolded at a party—you have no clue if you’re nailing those moves or stepping on someone’s toes.
Why should you care about metrics? Well, imagine you’re running an online store, selling cat food. You put in a ton of effort—designing the website, creating witty product descriptions and even hiring a professional cat model.
But if you don’t measure the impact of your marketing activities, it’s like shouting about your feline food in a soundproof room—no one will hear you!

KPI’s Vs Metrics: What’s The Difference?
Some may consider this to be splitting hairs, but we disagree. Metrics are all about tracking performance and progress in specific activities, while marketing KPIs, on the other hand, are all about measuring performance based on your key business goals.
Imagine you’re running a hot dog stand. Metrics are like the little things you measure every day, like how many sausages you grilled or how much mustard you squirted. But KPIs – they’re the big, juicy goal that tells you if your hot dog stand is the talk of the town or just a sad sausage fest.
KPIs are strategic. They’re the guiding stars that help you stay focused on what truly matters to your business. Metrics, on the other hand, are often more operational or tactical. They’re like the gears that keep the hot dog stand running smoothly on a day-to-day basis.
This video shows how we take a number of marketing metrics and begin creating KPI’s around them:
What Are The Most Important Digital Marketing Metrics? 📈
It all depends on your business and what your goals are. What is an important metric for one business might be completely separate to another.
For example, a business whose marketing strategy focuses almost completely on driving traffic to their website will want to focus on KPIs such as website traffic and conversion rates. However, this is totally different to a company that solely focuses on gaining leads through Facebook ads, who instead might want to focus on measuring Return on Ad Spend (ROAS) instead.
Want A Free Video Audit Of Your Website & Marketing Strategy?
Book your FREE digital review today and one of our marketing strategists will record you a personalised video and growth plan
The Fundemental Types Marketing Metrics & KPI’s
Business Performance Metrics
Business performance metrics are your overarching measurements that help assess the overall success and progress of a business. They provide valuable, high-level insights into various aspects of operations, marketing and finances, allowing business owners to track performance and identify areas for improvement.
There are two critical business performance metrics that are the cornerstone of marketing – customer per acquisition (CPA) and customer lifetime value (LTV). These are like the ultimate success metrics.
Cost Per Acquisition (CPA)
Cost Per Acquisition (CPA) is a metric that measures the cost associated with acquiring a new customer. It represents the amount of money a business spends on marketing, advertising and sales efforts to bring in a single customer.
Here’s the deal: when you’re trying to attract customers, you invest in various marketing tactics, like social media ads, email campaigns or collaborations with influencers. All of these efforts require money, right? Well, CPA is the metric that tells you exactly how much you’re shelling out to acquire each new customer.
You want your CPA to be as low as possible. Why? Because it means you are getting more customers for your bucks.
How to calculate your CPA
Cost of ad ÷ number of customers = customer per acquisition
Let’s say you spend $200 on a targeted Facebook ad campaign, and as a result, 20 people end up purchasing your fabulous socks. That means your CPA is $10 ($200 divided by 20 customers). Which is basically the cost of acquiring one new customer.
Customer Lifetime Value (LTV)
Customer Lifetime Value (LTV) measures how much revenue a customer generates throughout their entire relationship with your business. It’s like knowing how much money you can expect from a loyal customer who keeps coming back for more exciting surprises.
You want your LTV to be as high as possible.
Why? Because it means your customers are staying with you for a long, long time.
How to calculate LTV
Customer lifetime value – customer value x average customer lifespan
Let’s say you own a movie streaming service that costs $30 per month, and on average, customers stay subscribed for 10 months. That means the average customer’s LTV would be $300 ($30 per month x 10 months). So, that’s the total amount of money you can expect to earn from that customer over their lifetime.
Now, the higher the LTV, the more valuable each customer becomes. It’s like finding a customer who loves your service so much that they keep their subscription going for years, bringing in consistent revenue.

By understanding the LTV, you can make informed decisions about how much you’re willing to invest in acquiring and retaining customers. It helps you evaluate the profitability of different customer segments and prioritise your marketing and customer retention strategies.
Note: the average LTV for a business differs depending on your industry.
Another note: your CPA should be directly proportionate to your LTV. If CPA exceeds LTV, then you are in trouble, because it indicates your business is not growing.
Website Metrics
Website KPIs and metrics are like the silent superheroes of the digital world. Every business, regardless of its size or industry, should care about their website metrics because they hold the key to unlocking valuable insights about their online presence and customer behavior.
Your website is like your hub of leads. And metrics provide a window into your customers’ preferences – what is working on your website and what is not. You can even break these down by individual traffic sources to find which of your marketing efforts are the most effective
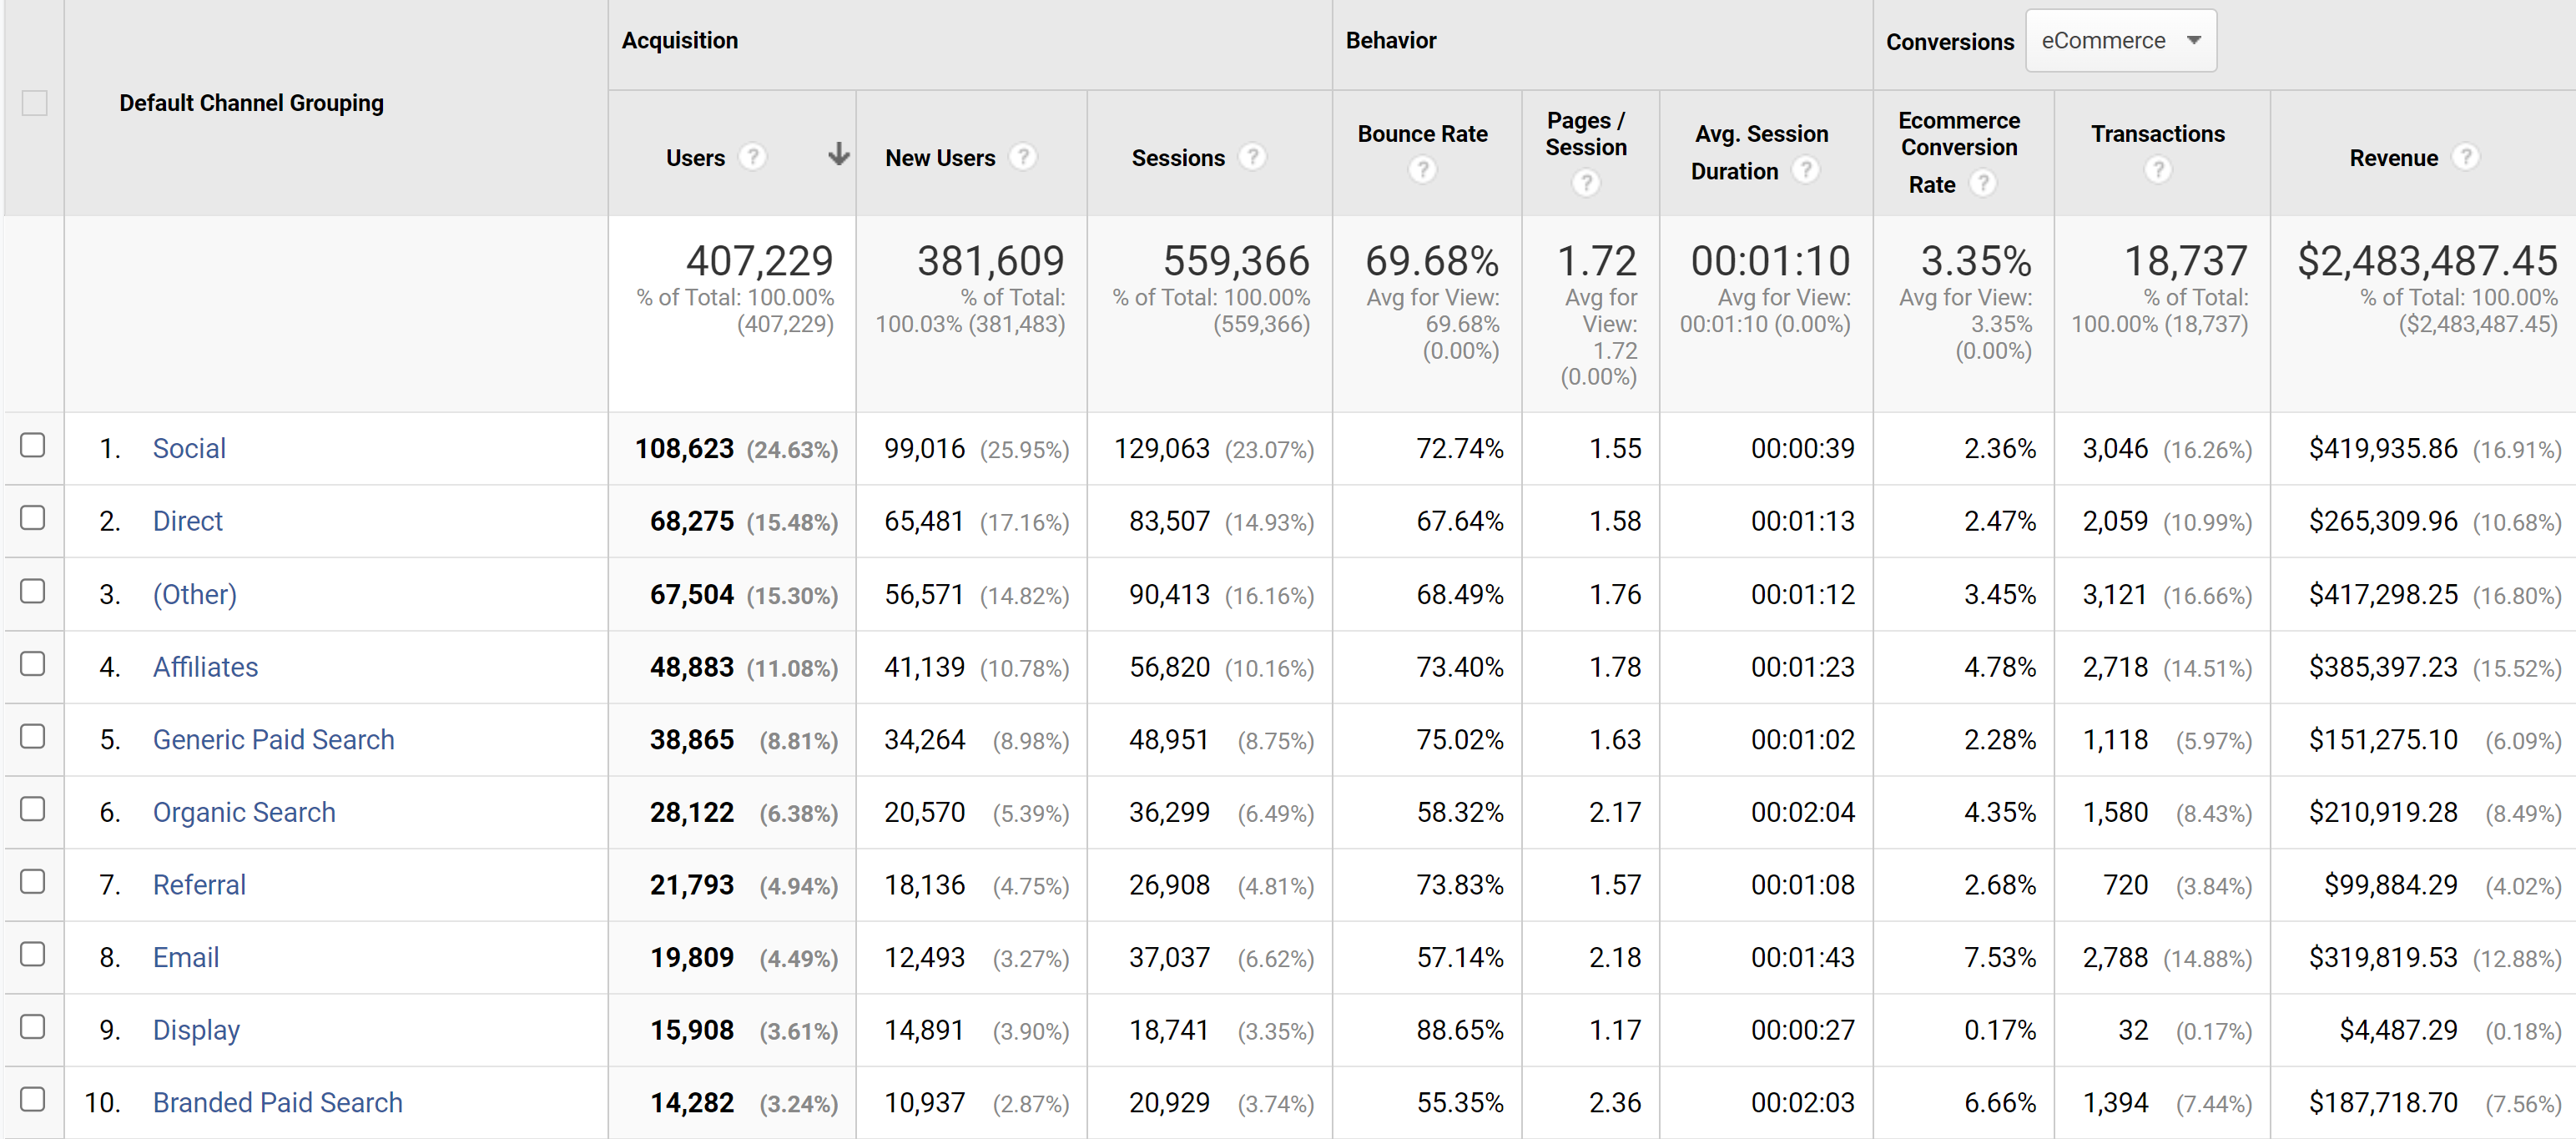
Website Metrics
Website KPIs and metrics are like the silent superheroes of the digital world. Every business, regardless of its size or industry, should care about their website metrics because they hold the key to unlocking valuable insights about their online presence and customer behavior.
Your website is like your hub of leads. And metrics provide a window into your customers’ preferences – what is working on your website and what is not.
There are two primary metrics you need to know about when it comes to your website: traffic and conversion rate. (And within traffic, there are a few more sub-metrics – let us explain).
Website traffic
Website traffic refers to the number of visitors who come to your website, representing the volume of people accessing and interacting with your web pages.
There are certain types of website traffic metrics we recommend you give particular attention to.
- Sessions
Sessions refer to the number of visits or interactions users have on your website within a specific timeframe. They help you understand the level of engagement and activity happening on your site.
- Unique visitors
This refers to how many individuals have been on your website. This metric is critical because they help measure the actual number of individuals interested in your business, allowing you to assess your marketing efforts and target audience effectively.
- Bounce rate
Bounce rate measures the percentage of visitors who land on your website but leave without interacting with any other pages. A high bounce rate may signal issues with user experience or content quality, while a low bounce rate suggests that visitors are finding value and exploring further.
Indicators of a healthy website are lots of sessions, lots of unique visitors and a low bounce rate, with a high average session duration.
Conversion rate
Your conversion rate is the money goal…

In other words, this is how we know are marketing is producing results.
Your website conversion rates effectively measure the success rate of turning website visitors into valuable “actions”. In simple terms, conversion rate is the percentage of website visitors who take a desired action or complete a specific goal on your website.
To use a hot dog stand analogy, it’s like counting how many hungry customers actually take a bite of your mouthwatering hot dogs after stopping by your stand.
These desired actions, or conversions, can vary depending on your business goals. It could be:
- making a purchase,
- subscribing to a newsletter,
- filling out a contact form,
- downloading a resource
The conversion rate tells you how effective your website is in persuading visitors to take that desired action.
It’s worth noting here depending on your business model, you may have multiple conversion goals you want to track all with varying levels of intent. For example in B2B, you might generate leads via a webinar signup (conversion goal 1) but then you’re next step is to book people onto a discovery call (conversion goal 2)
The Key To Achieving Your Digital Marketing Success Metrics ✅
No metrics should be looked at in isolation.
When it comes to digital KPIs and metrics, it’s essential to avoid viewing them in isolation. Instead, taking a holistic approach allows you to gather a complete and accurate understanding of your marketing performance. Just like assembling the pieces of a puzzle, analysing metrics collectively helps you see the full picture of how your marketing efforts are performing.

Here’s an example: CTR high, but conversions low
Imagine you’re monitoring the metrics of your social media ads leads to a landing page. You may receiving a huge click-through rate in your ads, but a poor conversion rate on your landing page.
This may suggest that, while your ads are working fine, your landing page isn’t optimised for conversions. That might be because:
- Your offer isn’t compelling enough
- Your copy is targeting the wrong audience
- Your landing page is too slow to load
- Your call-to-action isn’t clear
Remember – metrics are like puzzle pieces. Each one contributes to the larger picture. By analysing them holistically, you can gain a comprehensive view of your marketing performance, identify areas of improvement, and steer your business towards growth.
So, embrace this comprehensive perspective to achieve digital marketing metrics success!
Want Better Results From Your Marketing?
Book your FREE digital review today and we’ll record you a personalised video going through your website, showing you how you can generate more website visitors and then turn those visitors into paying customers.

He is a self-confessed Digital Marketing geek and is obsessed with consumer psychology and human behaviour.
In his spare time, Tom is a big advocate for meditation and self-development. He's also an avid gamer and lover of gadgets 🎮📱
- Highly-Effective DTC Marketing Strategies & Examples - February 28, 2024
- How To Set Paid Media Marketing Budget - October 16, 2023
- The Ultimate Guide To A/B Testing - September 23, 2023



Social Media & Ad Platform Metrics
Finally, social media metrics are the analytical tools that help businesses gauge the performance and impact of their social media efforts. Think of them as like your ‘digital spies’, providing valuable insights into how your social media presence is influencing your audience.
Imagine you’re running a trendy coffee shop and you decide to ramp up your social media presence to attract a latte-loving audience. You start tracking social media metrics to see how well your efforts are paying off.
Here are the most important media metrics you should be paying attention to:
These represent the total number of times your social media content is displayed to users.
While it showcases the potential visibility of your posts, its utility is limited. That’s because it doesn’t provide insights into actual engagement or conversions, making it important to consider alongside other metrics.
Your CTR is a more valuable metric. It calculates the percentage of users who clicked on a link or call-to-action within your social media content, thereby tracking the actual effectiveness of your content in driving user engagement.
In other words, a high CTR can indicate how well your messaging aligns with user interests.
Frequency represents the average number of times an individual has been exposed to your social media content. While a higher frequency can increase brand awareness, it’s important to strike a balance as excessive repetition can lead to ad fatigue and annoyance among users.
Cost Per Click is the amount you pay for each click on your ads. It helps evaluate the efficiency of your advertising budget and allows you to optimise your campaign by identifying the most cost-effective channels and targeting strategies.
The formula for calculating CPC is:
Let’s say you ran a social media ad campaign that cost $500 and generated 200 clicks. To calculate the CPC, you simply divide the total cost ($500) by the number of clicks (200):
In this example, the CPC would be $2.50. Keep in mind that the CPC can vary depending on the social media platform, bidding strategies, targeting options and other factors
It’s also important to understand there a number of variables that can affect your CPC – this video covers this particular metric in more detail