You are going about your day, watching your web analytics and swelling with pride as your campaign is going exactly as planned. However, one day, the winds of change blew in and suddenly your ranking plummeted.
It finally happened (again): Google’s algorithm updated.

Fear not, the lord of our kingdom is not so fickle and Google has offered a detailed description of its new update. Adding further complexity to its ranking algorithm, Google is taking into consideration what it calls Core Web Vitals in an attempt to rank based on-page experience.
What is Google’s 2021 Page Experience update?
Implemented in June, the page experience update is part of Google’s larger plan to refer users to websites that prioritize user experience. Before this update, it was good practice to have a user-friendly website (mobile-friendly, quick loading time, intuitive layout, etc.). Now, it is imperative, as it will directly affect your ranking.
To measure the user experience, Google has established three main metrics of its Core Web Vitals:
- Largest Contentful Paint: Measures loading performance.
- First Input Delay: Measures interactivity.
- Cumulative Layout Shift: Measures visual stability.
Each of these metrics comes with its range of “good,” “needs improvement,” and “poor,” with each score affecting the ranking of the page on search results. Additionally, Google considers the page “passing” if it reaches the 75th percentile of all page loads for each metric.
Largest Contentful Paint (LCP)
To get into the weeds, LCP measures the load performance by assessing the “perceived load speed,” which is the speed at which a page can load and render all the visual elements. LCP assesses this by reporting the time at which the largest text block or image loads relative to when the page first started loading (hence the “largest contentful”).

LCP is a user-centric metric, meaning that this is trying to get to the heart of the everyday experience of real users, not some distilled test done in lab conditions. However, this makes capturing this metric all the more difficult, as the loading speed can vary based on the user’s connections and devices. Therefore, Google uses “field” instead of “lab” reporting, meaning that Google Analytics uses “real user monitoring” to monitor and report the everyday traffic of users on your website, building up your LCP score along the way.
Initially, LCP is only looking at certain elements, including <img>, <image> within <svg>, <video>, element with a background loaded using URL() function, and block-level elements. It looks for the largest of these elements by looking at the largest size that is displayed in the viewport, not necessarily file size or original sizes.
First Input Delay (FID)
Another user-centric metric is FID, which reports how long it takes for the website to process user actions (clicking a button, beginning a javascript event, clicking a link, etc.). In short, FID is trying to measure your website’s interactivity.

Again, here Google is essentially making certain SEO principles the law of the land. Before, interactivity could help lead users through your website and help with conversion, inadvertently helping your ranking by becoming a well-known and trusted website. Now, better interactivity directly benefits your ranking.
Cumulative Layout Shift (CLS)
CLS is a little more complicated, as this score measures your website’s visual stability (or rather instability). A good example of this would be when a user goes to click on a button or link and the elements suddenly shift, causing the user to misclick.
 Not only can this be irritating, but it can lead to undesirable outcomes.
To measure the instability of your website, Google analyzes layout shifts. Through the normal usage of the page, elements shifting can be routine, but too much can be flagged as unstable. Here, Google looks at the largest burst of layout shifts within a given window, with the lowest amount of shifts being desirable. It should be noted that the addition of new elements, such as dropdown menus, does not cause a shift unless it causes other elements to change from their starting position.
What Core Web Vitals & Google’s Page Experience Update means for SEO in 2021
This update isn’t all bad news for SEO. Google’s web core vitals actually can make it easier for you to reap the benefits of good web design practices. To “optimize the algorithm,” you first have to optimize for your very human users.
In essence, this recent update heightens the importance of good web design practices.
How to measure your Core Web Vitals
Before you embark on updating your SEO tactics, you should first find out what you are scoring on your web core vitals. As mentioned before, these can be difficult to measure, as they are user-centric and field reporting metrics. Luckily, there are a few tools out there that can give you a good idea of the score that Google assigns your page.
PageSpeed Insights: Provided by Google, this tool relays the field data from Google’s Chrome User Experience Report. Here, you can directly see some of the same data that Google is using to evaluate your website along with Google’s own evaluation from a 28-day period. For example, PageSpeed will provide a score and give a brief statement, saying that the page either passes or fails the Core Web Vitals assessment.
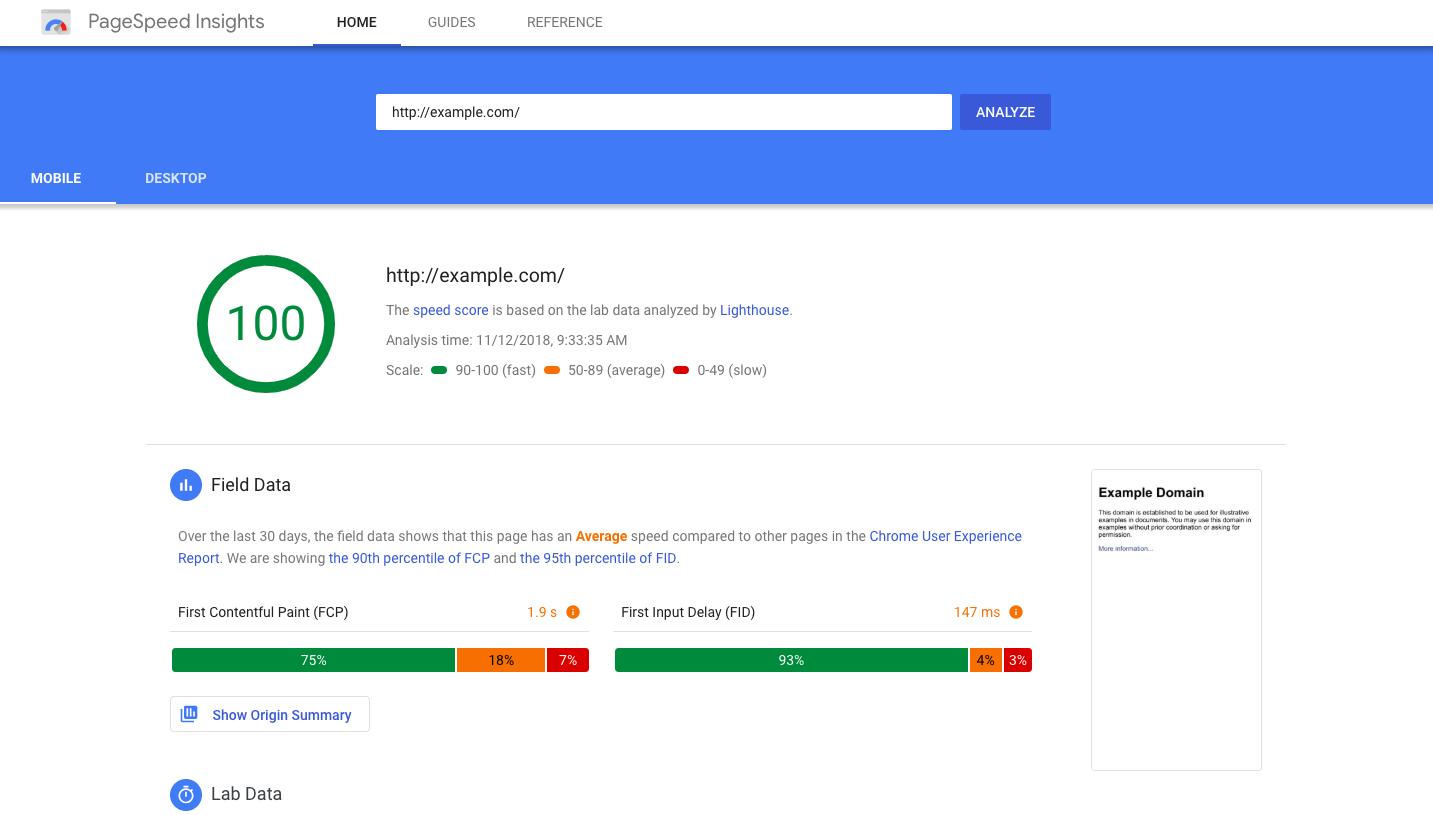
The field data is conveniently broken down into four scores, with the latter three being marked as Core Web Vitals:
- First Contentful Paint
- First Input Delay
- Largest Contentful Paint
- Cumulative Layout Shift
Each metric details what percentage of loads for the page fall into their three categories of “poor,” “needs improvement,” and “good.”
PageSpeed also provides some lab data (powered by Lighthouse, which we will get to later) and, here is the important bit, specific opportunities for improvement and their estimated savings in time. For example, PageSpeed could highlight reducing unused JavaScript as an opportunity for saving 17.89 seconds. With each opportunity, there is a drop-down menu that points out which Core Web Vital it could help improve (LCP, in the previous example) and specific locations where the improvement could be executed.
Lighthouse: This tool, which is also used by PageSpeed in its Lab Data section, can give a picture of your website but lacks the field data from PageSpeed. Essentially breaking down the metrics of the website with the same categories of PageSpeed, Lighthouse gives scores and places for opportunities.
To access Lighthouse, simply go to inspect a webpage and navigate to the tab that says “Lighthouse.” From there, you can generate a report either for mobile or desktop versions of the webpage.
Steps you can take to improve your Core Web Vitals
With the insight gleaned from these tools, you can begin isolating and tackling the largest issues holding back your Core Web Vitals.
- Server Response Times: Slow server response times can obviously affect the loading time of your largest page element. Sometimes this can be caused by non-optimized themes for your page. You should make sure that all your themes are properly optimized and not too bulky for the server to render. Another issue could be the server itself, either its connections or its hardware. If this is the case, you should consider a different hosting service. Finally, the issue could be how your server makes use of caching. If your page doesn’t need to be dynamically reconstructed every time, you should look into caching systems that save the already constructed page for loading next time.
- JavaScript and CSS: When your page is being rendered, excess JavaScript or CSS can halt the rendering process and fetch the appropriate stylesheets or scripts. To get around this, be sure to minify your CSS and remove any unnecessary formatting or unused style elements or scripts, and defer any non-crucial code until after the most important parts of the page are rendered.
- Asynchronous tasks over long tasks: Large and long tasks can take up the main thread, blocking a lot of important tasks involved in rendering. To overcome this, it is best to break up these larges tasks into smaller, asynchronous tasks, freeing the main thread.
- Idle-until-urgent: This method for running tasks can greatly improve your FID score. This methodology combines the best of two other approaches (eager and lazy evaluation), as it runs important tasks for the interactivity of the website when idle and then focuses on other, more urgent tasks when the moment calls for it.
- Give Images Dimensions: One of the biggest reasons for a low CLS score is undimensioned images. Preformmating images with the height and width tags can tell the browser how much space on the page to allocate for the images, so when they load, they load perfectly into their spaces without pushing other elements around.
- Advertisements: This one can be a bit tricky. We all hate loading a page, viewing some text, then getting hit with an onslaught of unprovoked ads, but some pages rely on these ads for valuable revenue. Even though these pages rely on advertisements, they could potentially hurt their ranking by affecting the page’s CLS. The key here is to reserve space and use placeholders for the ad slots. When the ad finally loads, there could potentially be some blank space, but it is better than causing your CLS to skyrocket.
Since it might take some time for these adjustments to immediately affect the field data collected by PageSpeed Insights, Lighthouse lab data can be a good way to assess the effects of these quick tips once implemented.
As Google’s method of ranking continues to grow in complexity, constant changes and updates are to be expected. To begin taking all of this into consideration be sure to follow our resources for recent news and updates on marketing and SEO strategies.
Want To Improve Your Page Experience & Convert More Visitors Into Leads & Sales?
Book your FREE website and marketing review today and we’ll record you a 15-minute personalised video showing you how to start generating more leads and sales with LESS spend on marketing

He is a self-confessed Digital Marketing geek and is obsessed with consumer psychology and human behaviour.
In his spare time, Tom is a big advocate for meditation and self-development. He's also an avid gamer and lover of gadgets 🎮📱
- Highly-Effective DTC Marketing Strategies & Examples - February 28, 2024
- How To Set Paid Media Marketing Budget - October 16, 2023
- The Ultimate Guide To A/B Testing - September 23, 2023